
How deriveCompressionPct Turns a Vendor Claim Into a Defensible Number
A vendor told you the agent will deflect 75% of your support tickets. A trade press article said 60%. An analyst at Forrester said 50%. None of those numbers belongs in your board deck — and the gap between them is exactly what an AI compression catalog has to solve before a CFO can sign anything.
Every compression percentage in the SeatCompress catalog runs through one function: min(sourcedClaim × discountFactor[source], categoryCap[class]). Two multiplications. Two lookups. The output is the only number that ever reaches a customer-facing surface — the action plan, the renegotiation playbook, the year-1 hero on the dashboard. The input — whatever the vendor, analyst, or press outlet originally claimed — is recorded as provenance and never displayed without its discount applied. This post walks through what the algorithm does, why each constant is set where it is, and what falls out the other side when a real claim hits it.
The problem: vendor claims are not catalog values
The naive way to build an AI agent catalog is to copy the numbers off the vendor's website. Decagon's homepage says 75% deflection on customer support. Sierra says 70%. Intercom Fin says 60%. Type those into a table, ship it, watch a CFO challenge any one of them in the first sales call.
The numbers fail under challenge for three structural reasons. First, vendor marketing optimizes the data — the case studies they publish are the ones that worked, not the median deployment. A flagship deflection number is real for the flagship customer, but that customer is typically the one running a relentless internal AI transformation program with C-suite air cover; the median enterprise realizes a fraction of that. Second, "deflection" and "compression" are not the same number. Deflecting a ticket does not necessarily reduce a Zendesk seat — a support team that handles 40% fewer tickets may still need the same headcount for the harder 40%. Third, claim quality varies wildly by source: a Gartner analyst writing for a paid IT-leader audience has different incentives than a vendor's own webinar slide.
If the catalog presents all four claims as equally valid 75% / 70% / 60% / 50% inputs, the CFO has no basis to discriminate, and the whole tool collapses to "trust the marketing." The discount factor is how we discriminate.
The algorithm in one line
final = min(sourcedClaim × DISCOUNT_FACTORS[sourceType], CATEGORY_CAPS[agentClass])
Five source types, four category caps. Every AgentToolImpact.compressionPct row in the database is the output of this function, run at write time. The raw claim is preserved as provenance; the final value is what the engine consumes.
Discount factors (src/lib/compression/derive.ts):
case_study: 0.70— A specific named customer outcome. The discount accounts for the publication bias: the case study you can read is the case study that worked.vendor_marketing: 0.50— The "up to X%" claim on a landing page or webinar. Halved because "up to" is statistically the 95th percentile of attempts, not the median.analyst: 0.85— Gartner, Forrester, IDC. The lightest discount because analyst numbers already build in conservatism: they're written for the buyer side, not the seller side.trade_press: 0.60— TechCrunch, Bloomberg, The Information. Halved-plus-a-bit because journalism on AI capabilities tends to repeat vendor framing without independent validation.judgment: 1.00— Internal estimate, no external source. Passthrough on the multiplier, but the category cap still applies, which is where the real ceiling lives.
Category caps:
vertical_replacement: 0.65— Agents that replace a specific tool's seat function. Decagon vs Zendesk. The cap is anchored to the Decagon precedent; we don't believe any vertical replacement legitimately exceeds it.assistant: 0.30— Multi-tool helpers that span several SaaS surfaces. OpenAI Workspace Agents, Notion Custom Agents. They touch many systems and replace none completely.augmentation: 0.20— Tools that add value without removing seats. Granola for Zoom. The Zoom seat does not get cut because the meeting got transcribed.horizontal_ai: 0.15— Generic LLMs sold as enterprise productivity layers. Mistral Le Chat Team, xAI Grok Business. High substitution friction; modest compression on adjacent SaaS at best.
The cap is the load-bearing constraint. The discount factor handles claim quality; the cap handles whether the agent class can structurally deliver the percentage at all. An "up to 95%" claim from a horizontal_ai vendor — and they exist — drops to 0.95 × 0.50 = 0.475, then gets clamped to 0.15. The vendor's marketing department is not given a veto over the catalog's structural model of the agent class.
Three claims, three outputs
Run three representative inputs through the function.
Claim 1: A vendor publishes a flagship case study showing 93% ticket deflection on a Decagon-class deployment. Source: case_study. Class: vertical_replacement.
0.93 × 0.70 = 0.651 → min(0.651, 0.65) = 0.65
65% lands in the catalog — the cap is the binding constraint, not the discount. The 28-point gap between the marketing number and the catalog value is what a customer is buying when they license SeatCompress. If a CFO challenges the 65%, the audit trail shows: original claim 93%, source case_study, discount 0.70, cap 0.65, output 0.65. The cap fires because no vertical_replacement agent — no matter how strong the case study — gets to claim more than the Decagon precedent ceiling. Every step is reproducible, and the stored catalog value for Decagon → Zendesk is exactly 0.65.
Claim 2: A horizontal AI vendor — let's stylize as Mistral Le Chat Team for this example — publishes "up to 95% productivity improvement" on its landing page. Source: vendor_marketing. Class: horizontal_ai.
0.95 × 0.50 = 0.475 → min(0.475, 0.15) = 0.15
15% lands. The cap is what stopped this. A horizontal_ai compression number is structurally limited because the agent does not replace a specific tool's seat — it sits alongside the user's existing stack and provides general assistance. The vendor's enthusiasm is captured as provenance; the structural ceiling is what the engine sees.
Claim 3: An internal judgment estimate on Granola Business as a Zoom augmentation. Source: judgment (no external citation). Class: augmentation. Raw estimate: 30%.
0.30 × 1.00 = 0.30 → min(0.30, 0.20) = 0.20
20% lands. Judgment passthrough on the multiplier; the augmentation cap is the constraint. The catalog tells the engine "this agent contributes value but does not cut Zoom seats below 20% no matter how internally confident we are."
In the seeded catalog as of today, the actual stored value for Granola Business → Zoom is 0.25 — a hair above the augmentation cap, because the row predates the cap and was carried forward under a different class assignment when the algorithm shipped. Augmentation versus assistant is a real classification decision that affects this kind of agent. Those decisions are visible in the provenance audit; they are not invisible aesthetic choices.
Why the constants are where they are
Every constant in deriveCompressionPct is defensible in a CFO meeting, which means each one has to be auditable rather than asserted.
The case_study 0.70 factor is calibrated against the published-vs-typical-realization gap visible in independent procurement data — Vendr, Spendflo, and Tropic aggregates of customer outcomes versus vendor-published case studies consistently land in the 60-75% realization range. We pick the upper end because case studies do contain real outcomes; we discount because the case study selected for publication is not the median deployment.
The vendor_marketing 0.50 factor is the harshest discount and the most-used. "Up to" language in vendor copy is statistically the 95th-percentile result. Halving it lands closer to the 50th percentile, which is the number a CFO actually needs.
The analyst 0.85 factor — only a 15% discount — reflects that Gartner / Forrester / IDC publish numbers for the buyer side of the market. Their incentives are aligned with the procurement office. We discount lightly because analyst numbers are themselves already conservative versions of the underlying vendor claim, and double-discounting overcorrects.
The vertical_replacement 0.65 cap is the Decagon-precedent ceiling. Decagon is the most aggressive credible compression we've seen on a vertical tool replacement (Zendesk); we model 0.65 as the structural maximum for any vertical_replacement agent regardless of source quality. The catalog values are also calibrated against this anchor: Decagon → Zendesk is seeded at 0.65 exactly.
The augmentation 0.20 cap separates "this tool gets cheaper" from "this tool gets better." A Zoom meeting that gets a Granola transcription is a better meeting; it is not a cheaper Zoom subscription. The cap forces that distinction into the catalog rather than letting it leak into the savings number.
This same trust contract is why we source every compression percentage. The discount factor only works if the source classification is correct, which requires the provenance to be inspectable.
Worked example: enterprise support team, 18,000 employees
An 18,000-employee SaaS company runs Zendesk at $115/seat/mo across 220 contracted seats, 195 of which are active — total Zendesk spend 220 × $115 × 12 = $303,600/year. The CFO is evaluating Decagon for the 2027 renewal.
If the catalog accepted a 75% deflection claim at face value, the engine's gross annual compression would compute as floor(195 × 0.75) × ($115 × 12) = 146 × $1,380 = $201,480/year. That number, dropped into the engine with no discounting, would dominate the agent's profitability scoring and push the deployment into "obvious yes" territory.
The catalog stored value for Decagon → Zendesk is 0.65 — not 0.75 — because the algorithm above clamps every vertical_replacement claim at the Decagon precedent ceiling. The actual gross annual compression the engine produces is floor(195 × 0.65) = 126 seats × $1,380 = $173,880/year. That is the number that hits the action plan.
Then the year-1 realization factor of 0.4 (per the realization factor methodology built into our action plan engine) reduces it again to a realistic $173,880 × 0.4 = $69,552 for the 2027 budget year. Decagon's cost on this stack — using the seeded catalog values of $5,000/mo flat plus $25,000 setup — is $5,000 × 12 + $25,000 = $85,000 for year one. Net annual is $69,552 − $85,000 = −$15,448.
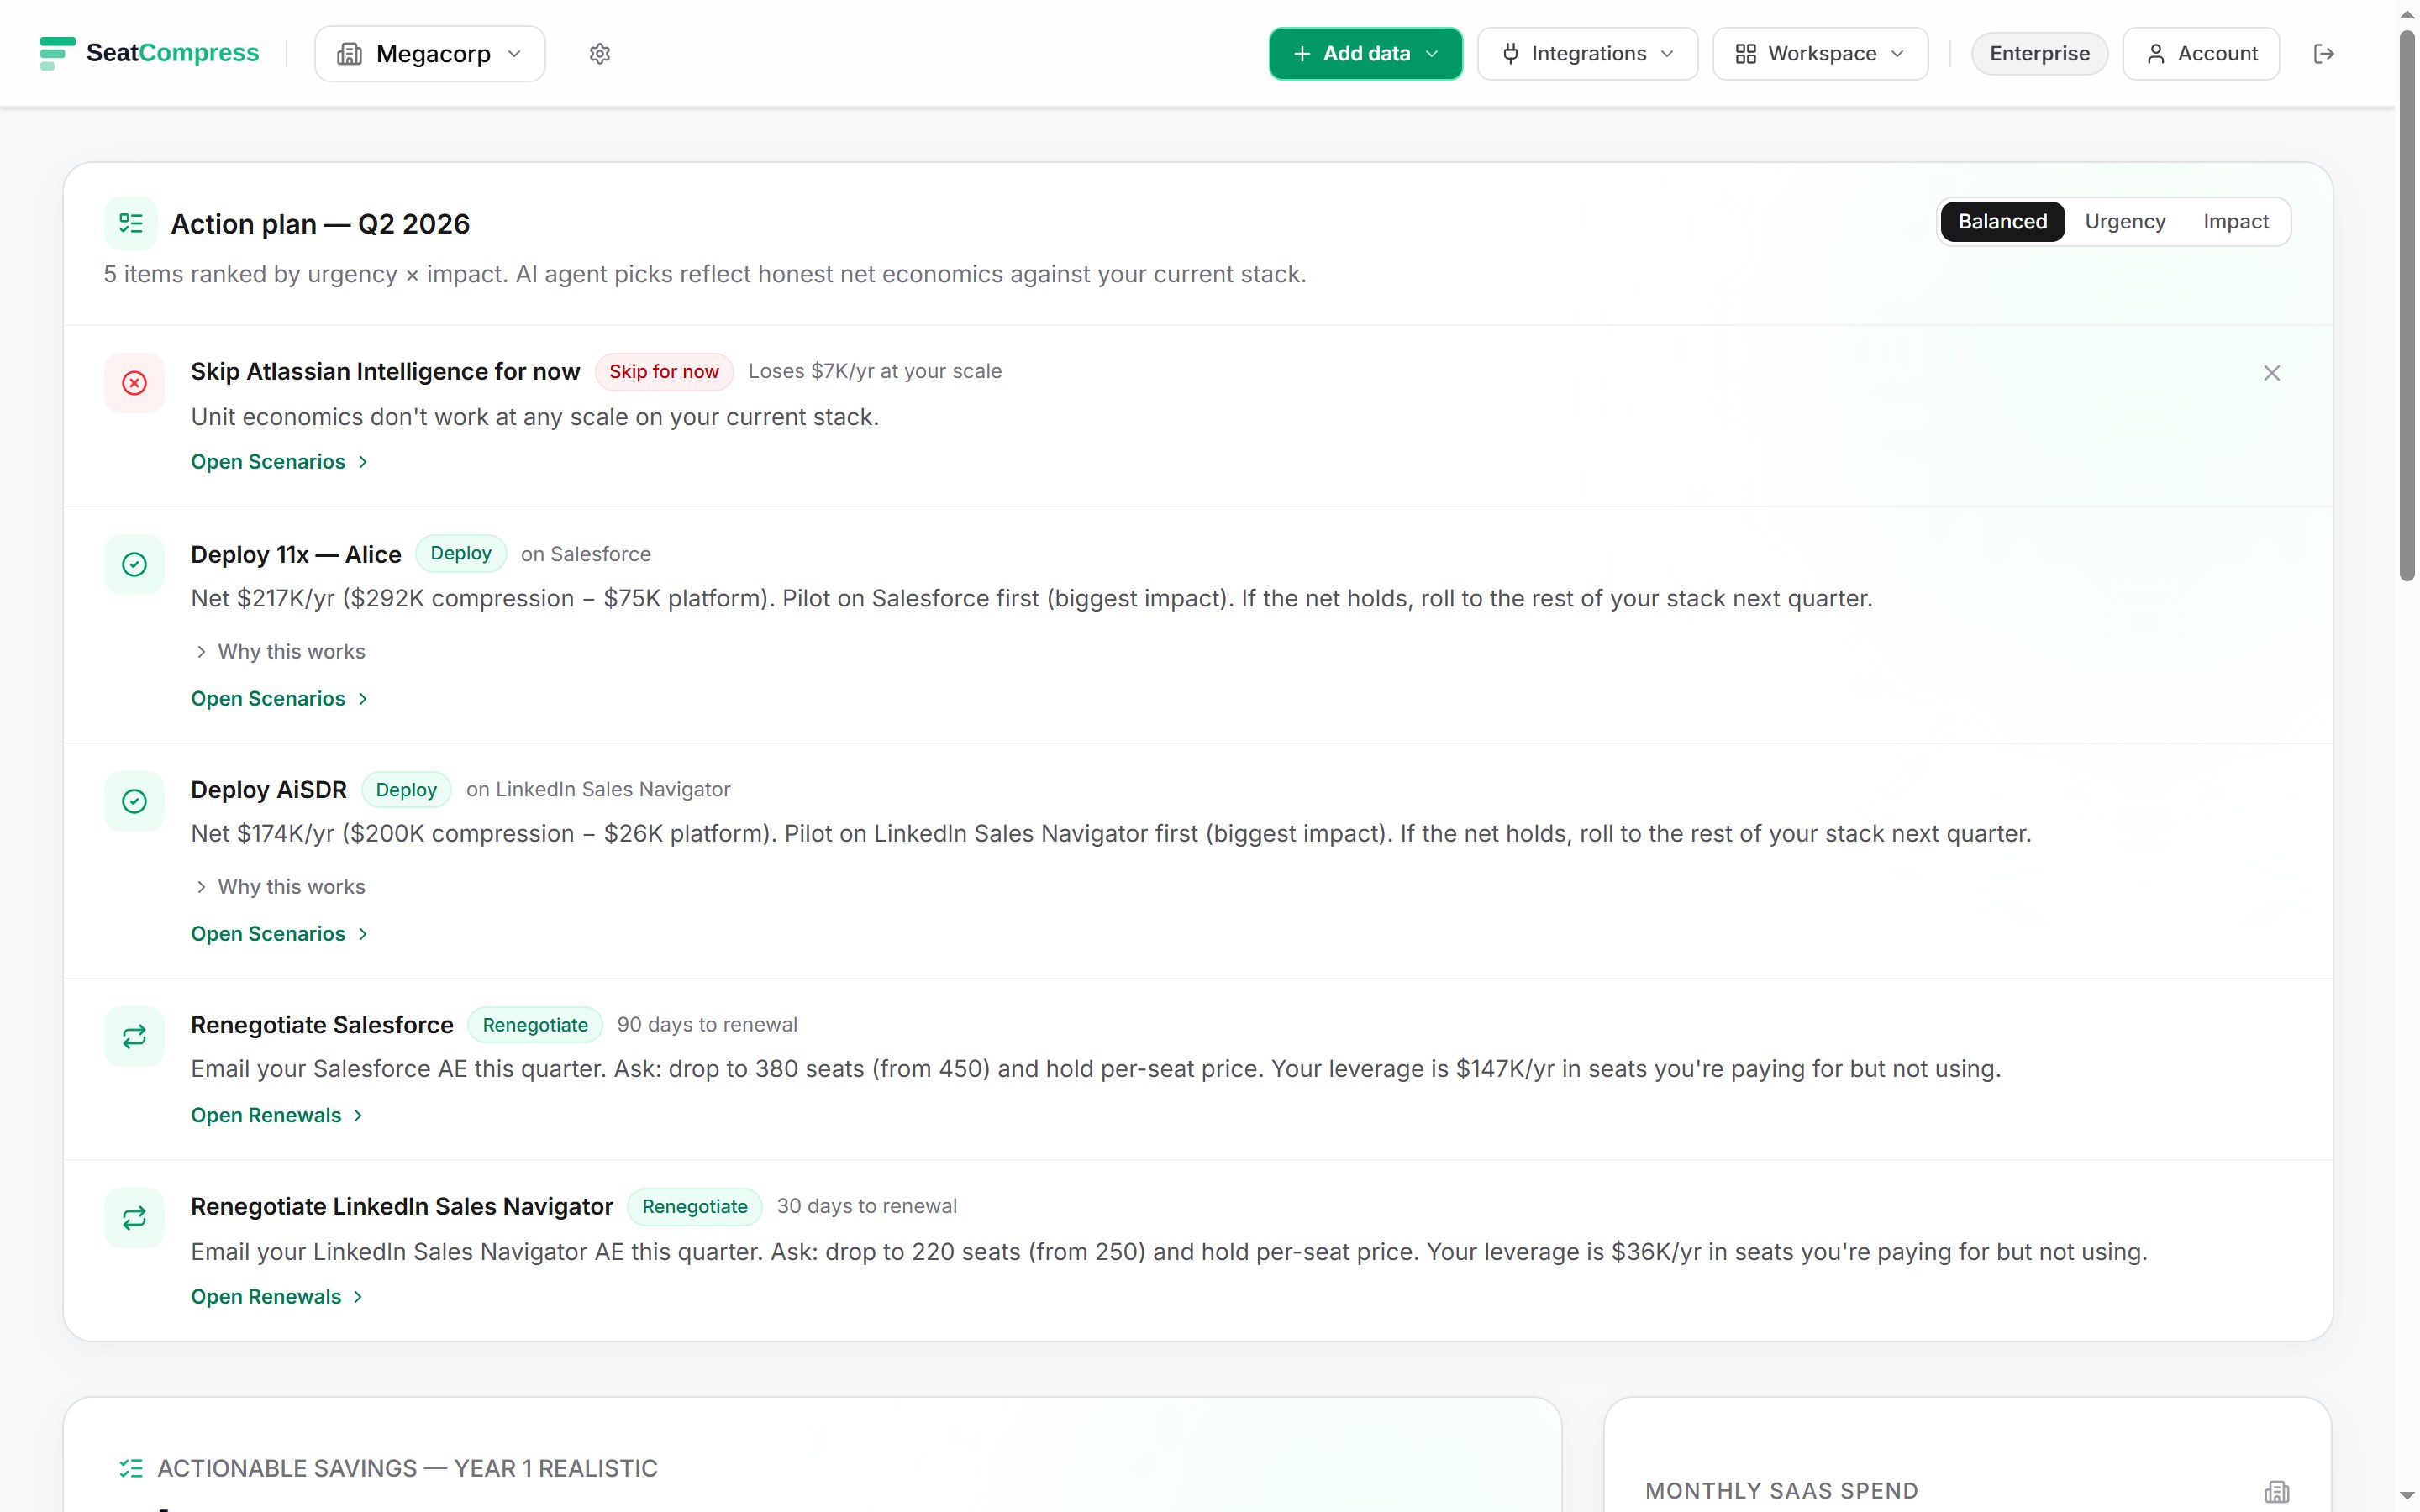
That net is outside the engine's break_even band, which is defined as |net| ≤ cost × 0.10 — for an $85,000 agent that means ±$8,500. A −$15,448 result is more than $15K underwater, so the engine classifies the deployment as unprofitable for year one. It will only surface in the action plan via the skip-slot ranking, and only if it lands closest-to-break-even among the unprofitable candidates on the stack. The CFO sees an honest "not yet" — not a false-positive "deploy now."
The same exercise on the un-discounted 75% claim would have produced a $201,480 × 0.4 = $80,592 realistic year-1 number against the same $85,000 cost — a −$4,408 net that lands inside the ±$8,500 band and would surface as break_even. Same stack, same vendor, same agent — but the catalog discount is what flips the recommendation from "watch this one as you scale" to "skip for now, revisit when active seats clear ~237." The CFO acting on the discounted number is reading a buyer-side model. The CFO acting on the raw vendor claim is reading a Klarna-class outcome and pretending it's their own.
This is what the algorithm is for. It is the difference between selling a CFO a vendor's case study and selling them a buyer-side model with citations.
What the CFO does Monday morning
Three checks for any AI agent vendor walking through the door:
1. What is the source of the compression claim? Get the citation. Case study, analyst report, vendor whitepaper, internal estimate — each gets a different weight in any defensible model. If the vendor cannot identify the source, that itself is the data point.
2. What class of agent is this? Vertical replacement (specific tool's seats), assistant (multi-tool helper), augmentation (adds value without removing seats), or horizontal AI (generic productivity layer). The class sets the structural ceiling. A horizontal AI tool sold as a productivity layer cannot, structurally, compress 60% of any specific SaaS tool — regardless of what the demo shows.
3. What is the realization factor on the deployment? Year-1 ramps are 30-50% of steady-state, not 100%. We use 0.4 in our year-1 realistic action plan math as the LeanIX / McKinsey anchor. If the vendor's ROI model assumes 100% realization in year one, request the model — and read the line items.
The deriveCompressionPct algorithm is two multiplications and a min(). Forty lines of TypeScript. But the constants are calibrated against years of public procurement data and the cap structure encodes a real model of what each agent class can deliver. That's why a 93% case-study claim becomes a 65% catalog value, and a 95% horizontal-AI claim becomes 15%. The math is small. The trust contract is the entire product.
Run your own AI agent stack through the model at the calculator. The number you get out is the number a CFO can defend.
Find your savings number in 30 seconds.
No signup, no credit card. Get the number, screenshot it, and decide if your CFO needs to know about us.