
Why Deploy-Agent Year-1 Realization Is 0.4, Not 1.0
Every AI agent vendor deck quotes steady-state savings. Every CFO budget needs year-one cash. The gap between those two numbers is where AI deployments stop being investments and start being write-downs — and the honest discount factor that closes it is 0.4, not 1.0.
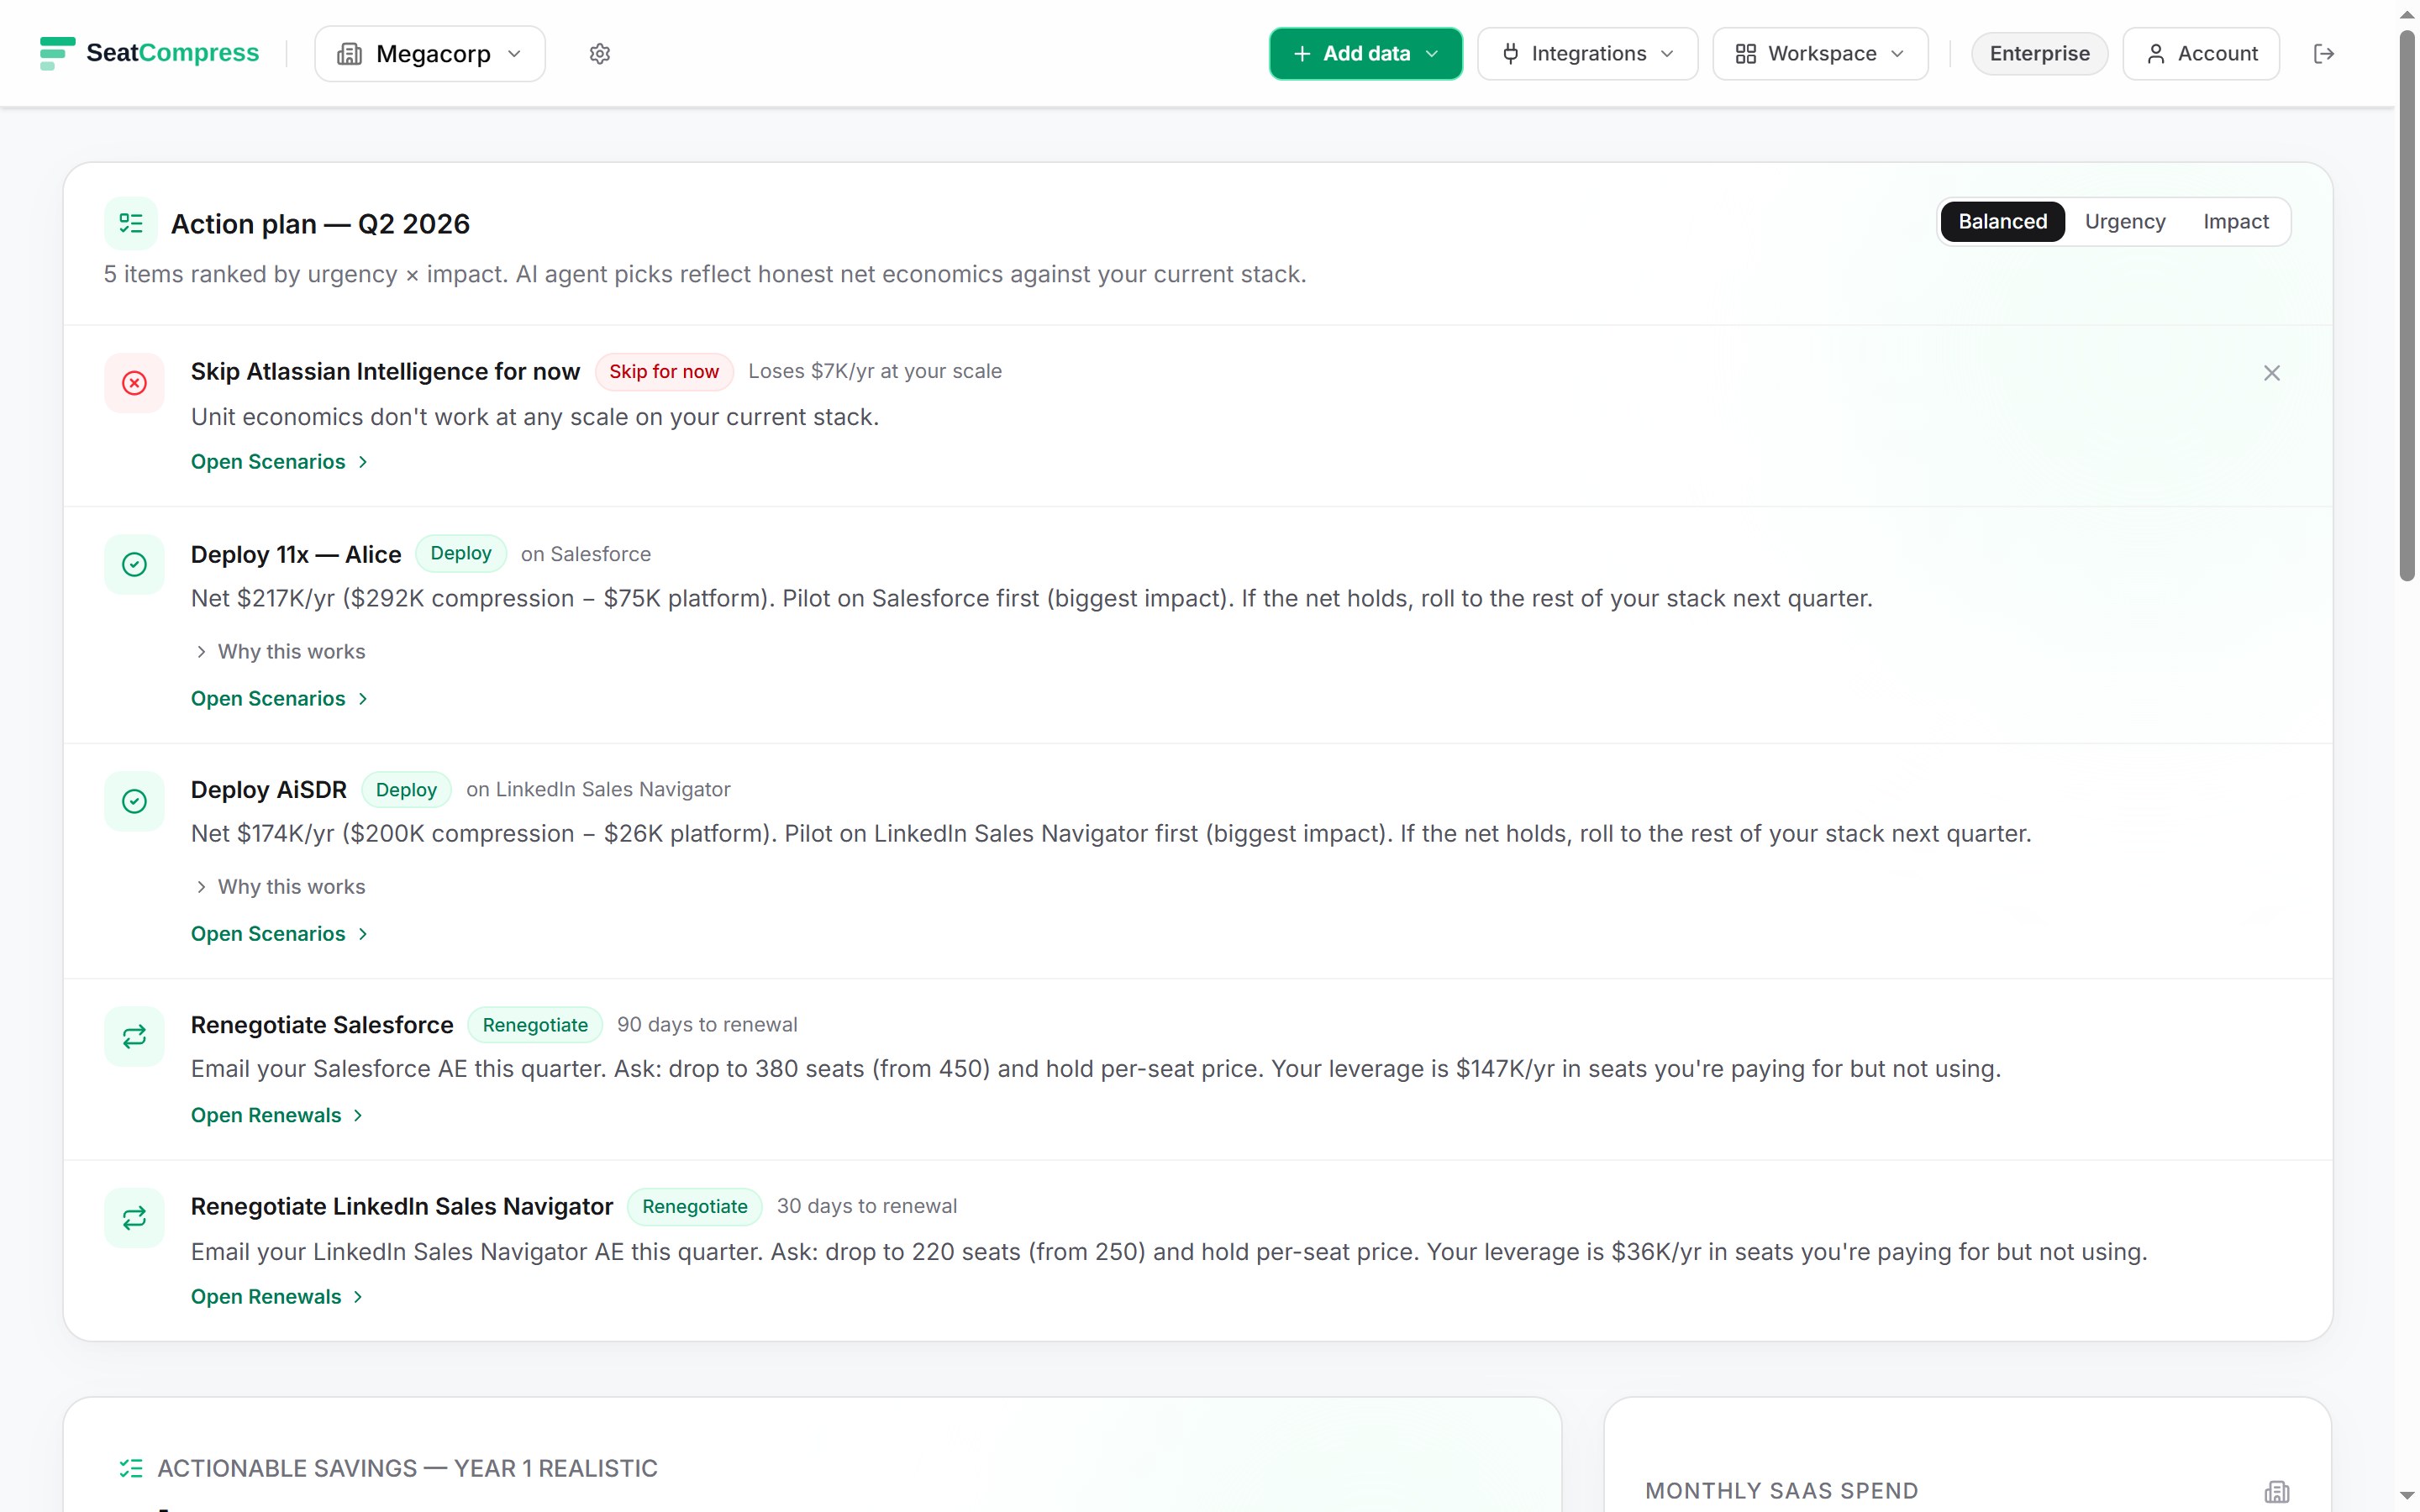
That number isn't a SeatCompress opinion. It's the constant REALIZATION_DEPLOY = 0.4 baked into the engine that scores every deploy-agent action item the platform recommends. Renegotiation gets 0.5. Skip-the-agent gets 1.0 (because not spending is the most realized form of savings there is). Deploys get 0.4 because first-year enterprise AI rollouts land at 30-50% of the steady-state ROI vendors quote — pilot scope, training data lag, change-management drag, and the simple fact that month-one users are not month-twelve users.
If you're a CFO at a 5,000-50,000 employee enterprise evaluating Sierra, Decagon, Moveworks, or AiSDR for next year's budget, the question isn't whether the vendor's quoted ROI is real. It usually is — at steady state, after the third quarterly review, with prompts tuned and edge cases triaged. The question is what hits the P&L in the twelve months you're actually committing to. That number is roughly 40% of the deck.
What the vendor deck assumes
A typical AI agent vendor pitch looks like this. Decagon compresses Zendesk seats by 65%. Sierra compresses Zendesk seats by 60%. Moveworks compresses ServiceNow and Freshservice by 30% and 35% respectively. AiSDR compresses Outreach and Salesloft by 30% each, Apollo.io and ZoomInfo by 20% each.
Those percentages are catalog values in the SeatCompress engine. They are also what the vendor will quote you in the pitch. The implicit math the vendor wants you to do is straightforward: you have 200 Zendesk seats at $115/mo each, Decagon takes out 65%, that's 130 seats × $115 × 12 = $179,400/yr in compression. Decagon costs $5,000/mo + $25,000 setup = $85,000 in year one. Gross savings $179,400 minus cost $85,000 = $94,400 net. Ship it.
That math is correct at steady state. It is also wrong for year one. Year one looks like this: $179,400 × 0.4 = $71,760 realized savings, minus $85,000 in agent cost = negative $13,240 net in year one. The deal pays back in year two and prints money in year three. But your FY26 budget shows a loss.
The 0.4 isn't a haircut applied because we're pessimistic. It's the empirical ramp curve. LeanIX and McKinsey's AI-adoption studies both put first-year realization at 30-50% of steady state. We picked the midpoint and shipped it as the constant. Every deploy-agent recommendation in the SeatCompress action plan applies it before the number ever reaches the CFO's screen.
The four reasons month-one isn't month-twelve
The 0.4 isn't one big drag. It's four compounding ones.
Pilot scope. No enterprise rolls Decagon out to all 200 Zendesk seats on day one. The standard pattern is one tier-1 queue, one geography, two months of side-by-side measurement. By the time the agent is handling 65% of the queue volume across the full deployment, you're nine months in. The first four months contribute almost zero compression.
Training data lag. Vertical replacement agents — Sierra and Decagon being the canonical examples — need 60-90 days of your actual tickets to tune from a generic 50% deflection rate up to the catalog 65%. The SeatCompress catalog encodes this directly via deriveCompressionPct: vertical_replacement claims cap at 0.65 even when the vendor quotes higher, and case-study evidence gets discounted by 0.30 before that cap applies. A vendor "up to 95%" case study lands at 0.95 × 0.70 = 0.665, clamped to the 0.65 vertical_replacement cap. The cap is the steady state, not the launch state.
Change-management drag. Your agents (the human ones) need to learn the escalation patterns. Your customers need to accept the AI handoff. Your QA team needs to build the audit harness. Every one of those tasks runs in calendar months, not engineering sprints. Month one, the agent is technically deflecting tickets but the support org is still over-staffed because nobody trusts the deflection rate enough to backfill headcount with the same confidence the pricing model assumes.
Month-one users aren't month-twelve users. The seats you'd notionally retire in month one — the most-junior, most-redundant 65% — are not always the seats that actually leave. Real attrition runs through specific roles, regions, and managers. The 65% compression rate is honest at steady state across a normalized workforce; in any given six-month window, you're hitting a smaller fraction because the right seats haven't naturally turned over yet.
Stack those four. You don't get 65% in year one. You get something like 25-30%. The 0.4 factor on the engine's gross savings number lands you in that range almost exactly.
How the engine actually applies it
realisticActionableSum in the SeatCompress action plan does three things. It sums the gross savings across every recommended action. It multiplies each deploy_agent action's contribution by 0.4. It multiplies each renegotiate and renegotiate_band action by 0.5. And it drops skip_agent actions out of the hero number entirely — they're "loss avoided," a different ledger, and rolling them into the headline overstates what hit your bank account.
The 0.5 on renegotiation has its own provenance worth naming. Vendr, Spendflo, and Tropic's aggregate public reports all converge on the same range: seat-reduction asks at renewal land 40-60% of theoretical max after vendor pushback, multi-year lock-in, and minimum-commitment floors. The midpoint is 0.5. The same arithmetic that makes us conservative on deploys makes us conservative on renegotiation — because the alternative is putting a number on the CFO's deck that loses credibility the first time procurement actually sits down with the Salesforce rep. (We wrote up the rate-cut side of this in the PEPM rate renegotiation primer.)
This is why a SeatCompress dashboard will frequently show a "theoretical" annual savings number two-to-three times larger than the "realistic year-one" hero. Both are true. The theoretical is what the deck supports if you assume linear, immediate, fully-staffed adoption. The realistic is what the controller will tie out against actual line-item changes in next year's budget.
A worked example: a 12,000-employee SaaS company
Take a synthetic enterprise — 12,000 employees, $14M annual SaaS spend, the kind of stack SeatCompress audits every week. They're evaluating four agents simultaneously: Sierra for support, Moveworks for IT, AiSDR for outbound, and Glean for knowledge search.
Sierra on Zendesk. 800 Zendesk seats at $115/mo. Sierra compresses 60%. Gross annual compression = 800 × 0.60 × $115 × 12 = $662,400/yr. Sierra costs $6,000/mo + $35,000 setup = $107,000 in year one. Vendor-deck math: $662,400 − $107,000 = $555,400 net, 519% ROI. Year-one realistic: $662,400 × 0.4 = $264,960 realized, minus $107,000 = $157,960 net. Still positive, still a clear yes — but 28% of the vendor number, not 100%.
Moveworks on ServiceNow + Freshservice. Assume 600 ServiceNow seats at $100/mo and 200 Freshservice seats at $49/mo. Compressions 30% and 35%. Gross = (600 × 0.30 × $100 × 12) + (200 × 0.35 × $49 × 12) = $216,000 + $41,160 = $257,160/yr. Moveworks costs $33,000/mo flat = $396,000/yr, plus the flat-fee setup rule of max($15,000, monthly cost) = a $33,000 one-time setup, for $429,000 year one. Vendor math at steady state: $257,160 − $396,000 = negative $138,840. Already unprofitable before setup. Year-one realistic: $257,160 × 0.4 = $102,864 minus $429,000 = negative $326,136 in year one. This is a skip_agent recommendation, not a deploy. The engine's discount factor exposed it as a bad deal twice over: the steady-state economics don't work, and year one is even worse. (We wrote up this exact pattern in more depth at per-resolution agents and the crossover point.)
AiSDR on Outreach. 80 Outreach seats at $100/mo. AiSDR compresses 30%. Gross = 80 × 0.30 × $100 × 12 = $28,800/yr. AiSDR is a flat-fee agent at $900/mo ($10,800/yr ongoing), and because it has no explicit setupCostUsd in the catalog, the engine applies the $15,000 enterprise flat-fee setup floor — so year-one cost is $10,800 + $15,000 = $25,800. Vendor steady-state math (ignoring setup): $28,800 − $10,800 = $18,000 net ongoing. Year-one realistic: $28,800 × 0.4 = $11,520 minus $25,800 = negative $14,280 in year one. The steady-state economics are clearly positive — at $18,000/yr ongoing surplus the $15K setup pays back inside the first full year of operation — but the 0.4 ramp still drags the first year underwater, because $11,520 of realized compression can't cover a $25,800 year-one bill. This is the kind of deal where the 0.4 factor matters most: the vendor deck shows a healthy steady-state positive, and it's real, but year one is still a loss the CFO would have missed reading only the slide.
Glean on Confluence + Notion + Box. Assume 1,200 Confluence seats at $5.16/mo, 800 Notion at $10/mo, 400 Box at $15/mo. Glean compresses 40% / 30% / 15% respectively. Gross = (1,200 × 0.40 × $5.16 × 12) + (800 × 0.30 × $10 × 12) + (400 × 0.15 × $15 × 12) = $29,722 + $28,800 + $10,800 = $69,322/yr. Glean at the enterprise tier costs $45/user × 1,200 users (max active across targeted tools) = $54,000/mo + $50,000 setup = $698,000 in year one. Vendor math at steady state: $69,322 − $648,000/yr ongoing = deeply unprofitable. Year-one realistic: even worse. Another skip_agent.
Across all four: vendor-deck steady-state total of roughly $1,018,000 in gross compression ($662,400 + $257,160 + $28,800 + $69,322). Year-one realistic deploys only Sierra ($157,960 net) and skips the other three. The CFO's defensible year-one number is $158K, not $1,018K. That's a 6.4× difference between what the vendor decks would have you commit to and what actually hits the FY budget.
This is the entire reason the 0.4 exists in the engine. Without it, the action plan would recommend deploying all four agents — three of which destroy value in year one and two of which never pay back. With it, the engine surfaces one deploy and three skips, and the CFO walks into the budget meeting with a number that survives the first round of questions.
Why this matters for board-deck math
There's a softer reason to use 0.4 that's worth naming: it's the discount factor that lets you keep your job after the year-one results come in.
A CFO who commits to $1,018K of AI-driven savings in their FY26 plan and lands at $200K in actuals doesn't get a do-over. The CEO doesn't accept "the steady-state math was right, we were just early on the curve." The board doesn't accept it either. The variance is the story, and the story is bad.
A CFO who commits to $158K and lands at $180K is a hero. The variance is positive, the deploys are working, and year two's plan can credibly reach toward the steady-state number because the year-one ramp is now empirically validated rather than vendor-quoted.
The 0.4 isn't pessimism. It's the version of the number that survives contact with reality, gets you a credibility-building year-one beat, and gives you headroom to commit to the steady-state savings in year two with actual evidence behind you. (We made the broader case for picking the metric that survives in why unused seats is the wrong CFO metric for 2026.)
What the CFO does Monday morning
Three concrete asks.
First, when a vendor sends a savings model, demand the ramp curve, not the steady-state number. Ask for month-by-month realized savings across their existing enterprise deployments. If they can't produce it, the 0.4 is your default. If they can, use their actual ramp — but verify it against a customer of similar size, not the lighthouse account they always cite.
Second, when reviewing internal action plans, divide every AI-deploy line item by ~2.5x before it enters the budget. The vendor-quoted ROI is roughly steady-state; year one is roughly 40% of it. If the deployment is still profitable after that adjustment, it's a real opportunity. If it isn't, you've avoided a write-down.
Third, run your stack through the SeatCompress calculator to see what the engine actually surfaces for your specific tool inventory. The 0.4 factor is already baked in. The hero number you see is the year-one realistic, not the vendor deck. The "theoretical" number underneath is what the steady state could look like in year three if every assumption holds. The gap between them — usually 2-3× — is exactly the credibility margin worth defending in front of the board.
The bottom line: a CFO's job is to commit to numbers that come true. The 0.4 realization factor is what makes the AI agent line item in your FY26 plan something you can defend twelve months from now. The vendor deck's number is something you defend exactly once, on the day you sign the contract. Pick the one you want to live with for the next year.
Find your savings number in 30 seconds.
No signup, no credit card. Get the number, screenshot it, and decide if your CFO needs to know about us.