
Dimensional SaaS Compression: Per-Seat Was the Wedge
Look at a 5,000-employee enterprise SaaS stack and four of the biggest line items are priced four different ways. Workday: $200,000/month, per employee. CrowdStrike: $112,500/month, per endpoint. Datadog: $66,000/month, per host-hour and ingested event. Salesforce: $195,000/month, per seat. Same dashboard. Four different financial instruments. One savings lever each.
Every SaaS spend platform built between 2019 and 2024 — Zylo, Vendr, Productiv, Tropic — treats those four contracts the same way. They score per-seat compression beautifully. They report the other three as "no compression lever," "100% utilized," or "out of scope." The waste is real, and they're not modeling it.
This post is the framework. Four pricing dimensions. Four levers. One CFO playbook that stops pretending the stack is monolithic.
Try the free calculator — 15 seconds, no signup.
Why per-seat became the default
The SaaS spend category was born in 2018 measuring assigned-but-unused licenses. Virtually every B2B tool sold by 2020 was per-seat per-month. The compression formula was clean: pull seat counts from Okta, pull login activity, subtract, take it to procurement. That formula built the category and works on per-seat contracts — we covered it in the seat-compression primer and the legacy unused-seats critique.
Then the next wave of enterprise SaaS quietly stopped pricing per seat. HRIS was per-employee. Endpoint security was per-device. Observability — Datadog, Splunk, Snowflake, Sentry — settled on usage and ingest. AI agents added per-resolution (Intercom Fin) and per-ticket-hour pricing. By 2026, a 5,000-employee enterprise runs four pricing dimensions in parallel, and the dollar-weighted majority is no longer per-seat.
The SMPs built around the seat metric kept running it. Their commercial model — a percentage of tracked spend — earns more when the bill stays high, so surfacing the 40% outside the per-seat lever undercuts the headline savings they advertise. The dashboards optimize the 20–30% of spend they can score and mark the rest "compliant."
Per-seat compression was the first lever, and a real one. The category framing has to expand or the savings number stays stuck.
The four dimensions, with the lever for each
Catalog the contract, then pick the lever. Mixing dimensions is how the math goes wrong on the first pass.
| Dimension | Examples | What's billed | The lever |
|---|---|---|---|
| Per-seat ($/seat/month) | Salesforce, Slack, Zendesk, Outreach | Provisioned user | Contracted-minus-active seats + tier downgrade |
| Per-employee (PEPM) | Workday, BambooHR, Rippling, Gusto, Deel | Total company headcount | Rate-vs-peer-band renegotiation |
| Per-device (per endpoint) | CrowdStrike, SentinelOne, Microsoft Defender | Managed endpoint | Decommission inactive devices + rate-vs-peer-band |
| Usage / per-resolution | Datadog, Splunk, Snowflake, Intercom Fin | Hosts, GBs ingested, resolutions | Commit-tier negotiation, sample/retention tuning, or labor counterfactual |
Each row needs a different question. We'll work through them with numbers grounded in the catalog.
Dimension 1 — per-seat ($/seat/month)
Settled territory. Pull contracted seats from the renewal letter, pull active seats from Okta, subtract. Layer tier downgrade where the published ladder shows a cheaper option. For a 5,000-employee enterprise on Salesforce Enterprise at $130/seat (the 100–499 band p50 in our catalog) with 1,200 of 1,500 seats logged in, the year-1 recoverable ceiling is (1,500 − 1,200) × $130 × 12 = $468,000, with the engine's year-1 realistic landing near $234,000 after applying the 0.5 renegotiate realization factor.
The legacy SMPs do this part competently. Our calculator overlays the AI-agent layer that Zylo and Vendr don't model, but the per-seat math itself is well understood. The interesting move is what happens at the next contract on the list.
Dimension 2 — per-employee (PEPM)
HRIS, payroll, performance, ATS, and global employer-of-record vendors price on company headcount. Every employee is "in" the system — no Okta provisioning gap to scrape. The legacy SMP marks the contract "100% utilized" and moves on. The savings ceiling on this dimension cannot come from utilization. It has to come from the rate.
For a 500-employee Acme:
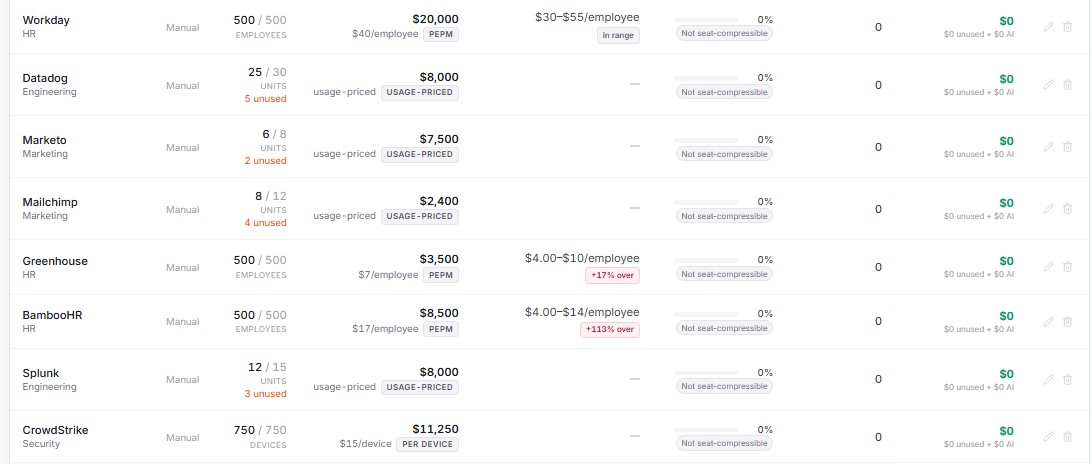
- Workday at $20,000/month = $40/employee. Workday's published peer band in our catalog is
null— explicitly sales-led, no defensible vendor-published ladder, anti-fabrication contract honored. The audit looks different: benchmark against your own RFP history and competitive-bid evidence, not against an invented number we refuse to fabricate. - BambooHR at $8,500/month = $17/employee. Vendr-pinned 500+ band: $6/employee (single-point). Acme is +183% over band. Target $6 × 500 × 12 = $36,000/year. Delta from current: $66,000/year off the bill, defensible from public peer data.
- Greenhouse at $3,500/month = $7/employee. Greenhouse's 250-999 band: $7/employee (single-point). Acme is at band. Hold the line — there's nothing to renegotiate here.
The seat-utilization lever is zero on every PEPM contract. The rate-vs-peer-band lever is enormous on at least one of them. SeatCompress's dimensional benchmark — the pricingDimension column on VendorBenchmark, shipped 2026-05-06 — separates "no utilization gap" from "no compression opportunity," and lights up the rate-vs-peer chip in red on the BambooHR row.
Rate-vs-band lever (PEPM)
  = (current PEPM − target PEPM) × employees × 12
target PEPM = published peer band for company's employee bucket

BambooHR Acme example
  = ($17 − $6) × 500 × 12
  = $66,000/year above market
A different number than "you have 50 unused seats." Same magnitude as chunky per-seat compression. Legacy tools don't surface it.
Dimension 3 — per-device / per-endpoint
CrowdStrike Falcon Enterprise: $15/endpoint/month at Acme's 750 endpoints, billing $11,250/month ($135,000/year). SentinelOne Core: closer to $8/endpoint. Microsoft Defender for Endpoint: bundled in E5 or priced as add-on. The bill scales with devices, not users — one employee can have a laptop, a phone, a workstation, and a kiosk endpoint. Provisioning sprawl runs hotter on the device side than the user side.
Two levers:
- Decommission inactive devices. Endpoints not checked in 30+ days. Devices for terminated employees that didn't fully deprovision. A 750-endpoint contract with 80 ghosts = $1,200/month, $14,400/year of pure waste.
- Rate-vs-peer-band renegotiation. CrowdStrike's negotiated rate at 1,000 endpoints with multi-year + bundled Identity Protection is closer to $10. If Acme's $15 is at the band's high end, that's a $3,750/month, $45,000/year lever at renewal.
SMPs don't model either. They sometimes import device counts from Intune or Jamf but don't surface a decommission queue or peer benchmark. SeatCompress's chip framework treats per-device exactly like per-seat above the API boundary — same comparison, different denominator. Every benchmark number traces to a vendor pricing-page URL.
Dimension 4 — usage and per-resolution
The dimension every dashboard punts on. Two sub-cases.
Sub-case A: classical usage pricing. Datadog, Splunk, Snowflake, Sentry. The bill grows when engineering grows. Three levers stacked:
- Commit-tier negotiation. Datadog gives 20–30% off for annual commit. Snowflake list is sticker; real deals 15–40% off depending on annual TB commitment.
- Sample / retention tuning. A 10% trace sample on Datadog APM cuts the bill 60–70% on noisy services with near-zero signal lost; 30-day log retention vs 90-day is a 3× compute-month delta.
- Tier-mapping audits. A Datadog Pro host that should be on Free, a Splunk Enterprise SVC that should be on Standard.
Sub-case B: per-resolution. Intercom Fin at $0.99/resolution. Decagon's hybrid tier. Ada's resolution-priced model. The lever isn't renegotiate the rate — it's the labor counterfactual: would your support team have hired N humans this year without the agent? Full formula in the Intercom Fin / Zendesk math. For a 12-agent Zendesk team growing 40% YoY, Fin can pay back $184,380 in year 1 — none of it tracked by an SMP.
The catalog's pricingModel: "usage" flag tells the engine to skip seat-utilization and route the row to labor-counterfactual + commit-tier. Dashboard then shows "no per-seat lever — model usage commitment and labor avoided" instead of "$0 saved."
Try the free calculator — 15 seconds, no signup.
Why the legacy SMPs render this as zero
Three architectural reasons. None malicious.
Seat-centric data model. Zylo, Productiv, and Vendr ingest "seats provisioned" and "seats active" from your IdP. The core entity is the user-license join. PEPM contracts don't have a seat row to compare against — every employee is a seat, by definition — so the row computes 100% utilization and exits early.
Seat-priced peer benchmarks. When Vendr publishes a benchmark, it's $/seat/month. No PEPM column in the marketplace UI. No per-endpoint column. No commit-tier column for Datadog. Internal data has these — negotiators use them at the table — but the customer-facing dashboard stops at per-seat.
The commercial model penalizes surfacing the rest. Every SMP charges 1.5–3% of tracked spend. A $66,000/year PEPM compression on BambooHR earns the same fee as $5,000 on Slack. The analyst headcount to model PEPM, per-device, and usage doesn't pay back at the platform's revenue line. So it doesn't get built.
This is an org-chart consequence. Categories eventually rebuild at the next layer when a startup ships what the incumbents skipped. We did the schema work because the customer signal was loud and our pricing model — flat per-tier subscription — gets compensated for surfacing the next dollar regardless of how big the original bill was.
How dimensional thinking changes the CFO playbook
Three changes when you stop treating the stack as monolithic.
The audit runs four passes, not one. Pass 1: per-seat compression. Pass 2: PEPM rate vs peer band — every HRIS, payroll, ATS, and EoR contract. Pass 3: per-device decommission queue + rate check. Pass 4: usage commit-tier audit + retention/sample tuning. Four passes, four stakeholders (HR for PEPM, IT for per-device, engineering for usage, ops for per-seat). The savings stack.
Renewal calendars get tagged by dimension. A BambooHR renewal in 60 days has a $66K/year peer-band lever. A CrowdStrike renewal in 90 days has a decommission-queue lever. A Datadog renewal in 180 days has a commit-tier lever. "Renegotiate the contract" applies to all three; the specific leverage differs. Our renegotiation playbook generates dimension-specific copy.
AI agents fit into the same taxonomy. The AI-agent compression story snaps into focus. Sierra is a flat-fee agent — its own dimension, own unlock-threshold math. Intercom Fin is per-resolution — labor counterfactual, not seats. AiSDR is per-user — per-seat lever cleanly. Cursor and Copilot too. The AI-spend levers post covers the related cost-control layer for the raw API bill (Claude/OpenAI/Gemini token rates) — same dimensional logic, different denominators (tokens, batch discounts, cache hits, commit rates).
You end up with a 4×N grid: dimension × tool. Each cell has its own savings number. Some are zero, and the engine says so. Most aren't, and the SMP framework can't see them.
The Acme stack, four contracts, $111K–$151K
| Tool | Dimension | Annual spend | Lever | Defensible savings |
|---|---|---|---|---|
| Workday | per-employee | $240,000 | No published peer band (sales-led) — RFP-and-bid benchmarking only | $0–$12K |
| BambooHR | per-employee | $102,000 | Rate-vs-band (+183% over band) | $66K |
| CrowdStrike | per-endpoint | $135,000 | Decommission + renegotiate | $15K–$59K |
| Datadog | usage | $96,000 | Commit-tier + retention + sample | $15K–$28K |
Total identifiable savings: $111K–$151K/year on four contracts. The legacy SMP report on the same four reads "Workday: 100% utilized. BambooHR: 100% utilized. CrowdStrike: 100% utilized. Datadog: no per-seat compression detected." Zero.
That's the visual asymmetry. The dollars are real. The dashboard says zero because the dashboard was built for one dimension and never updated.
The unifying argument
Every SaaS contract has a billable unit. Per-seat bills per provisioned user. PEPM bills per employee. Per-device bills per managed endpoint. Usage bills per host, per GB, per resolution. The compression lever lives at the level of the billable unit. Match the lever to the unit, and the savings ceiling is honest. Use the wrong lever and the number is wrong.
The legacy SMPs used the per-seat lever on every contract because that's the lever they built first. They marked everything else "100% utilized" — technically true, operationally useless. 100% utilization on a $240K/year Workday contract whose pricing is sales-led with no published band is one story. 100% utilization on a $102K/year BambooHR contract at 183% over the published peer band is a wildly different story. Same green check on the legacy report. Different reality on the bill.
Dimensional compression is the reframing: catalog the billable unit first, then pick the lever. That's why our renegotiation playbook reads differently per contract — PEPM gets peer-band statements, per-device gets decommission-queue suggestions, usage gets commit-tier framing, per-seat gets the classic contracted-minus-active math.
How this changes which vendor you pay
The right question isn't "which platform finds the most waste." It's "which platform models all four dimensions, not just the one they built their dashboard around."
By that question, Zylo, Vendr, Productiv, and Tropic share the same gap. They're still excellent at per-seat compression, contract calendar management, shadow-IT discovery, and renewal workflow (honest comparison). For $5M–$20M tracked spend, one of them is still the right base layer. The dimensional layer goes on top.
Two operational changes regardless of platform:
- Tag every contract with its pricing dimension alongside renewal date and notice window. Without the tag, the audit defaults to per-seat thinking and you miss 40% of the savings ceiling.
- Don't accept "100% utilized" on PEPM, per-device, or usage contracts. The verdict is only meaningful if the rate-vs-peer-band check was also run.
The bottom line
Per-seat compression was the wedge. It built the category, and it still works on per-seat contracts. But the dollar-weighted majority of a modern enterprise stack is no longer per-seat, and the platforms built around the seat metric haven't extended the framework. The four-dimensional view — per-seat, per-employee, per-device, usage — is the underlying physics of how SaaS is priced in 2026, and each dimension has its own compression lever that doesn't reduce to "find the unused seats."
A 500-employee company auditing four contracts the right way recovers $111K–$151K of annual spend. The same four contracts in a legacy SMP dashboard show zero. Same data. Different framework.
Try the free calculator — 15 seconds, no signup. Paste a stack, see the per-seat number alongside the PEPM, per-device, and usage rows. Every number traces to a vendor pricing-page URL or the published peer-band data. That's the trust contract. The dimensional view is the product.
Find your savings number in 30 seconds.
No signup, no credit card. Get the number, screenshot it, and decide if your CFO needs to know about us.